Writing Task 1
IELTS Writing Task 1
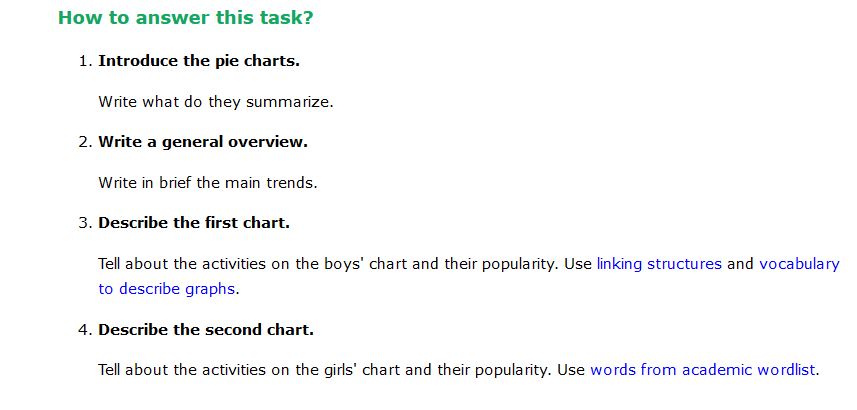
Introduction:
The Supplied/Given………………graph indicates/illustrate, depicts information about ……….. what ……..where ….. when.
Body Paragraph:
To begin with/at first glance, it is quite evident/it is clear that ……… (you have to compare high numbers or trends with lower), However/Moreover,………. Year ……..(Compare less significant trends or numbers) ……. there after ……..(write about two unique numbers or information )…….. respectively.
Body Paragraph:
Moving ahead, …….swiftly /rapidly / significantly increased. Although /However……….dramatically decreased /dropped, toppled. In contrast …… remained unchanged/constant/ same in …….. year….. finally.
Overall:
Hence, it is scrutinized /analyzed that. In the overall time period……. Is/was maximum , while /whereas…… recorded minimum.
IELTS Writing Task 1 Question with Answer Asper Upper Structure:
Introduction:
The Supplied/Given line graph indicates/illustrates, depicts information about the average cost of mobile and landline phone services between 2001 and 2010 for American customers.
Body Paragraph:
Body Paragraph:
Moving ahead, …….swiftly /rapidly / significantly increased. Although /However……….dramatically decreased /dropped, toppled. In contrast …… remained unchanged/constant/ same in …….. year….. finally.
The line graph illustrates the average cost that American customers spent on mobile and landline phone services annually over a 10-year period.
Overall, spending on residential phone services dramatically declined, while popularity of mobile services increased sharply throughout a decade. Also, both of services met at the same record in 2006.
In 2001, spending on mobile phone services began by merely $200, while the amount of annual expenditure on the residential phone services was around $700. Over the following five years, expenditure on landline phone services gradually dropped below $600, whereas expenditure on cell phone services rose to just over $500.
In 2006 cell phones overtook landline phones, and the services became equal in popularity with customers’ annual expenditure of about $550. Then, cell phone expenses rose to approximately $750 in 2010, making nearly a fourfold jump relatively to its initial figure in 2001. Meanwhile, spending on residential phone services experienced a steep fall in 2007 and went on to steadily decrease for the rest of the period.
Overall:
Hence, it is scrutinized /analyzed that. In the overall time period… spending on residential phone services dramatically declined… Is/was maximum , while /whereas… popularity of mobile services increased sharply throughout a decade.… recorded minimum. Also, both services met the same record in 2006.
